Debugging a PhoneGap App
At Stix, we've been porting our web client to PhoneGap over the past 4 months. True to the focus principle of the Lean Startup approach, we've been focusing on iOS as the target.
While we've had to work at several obstacles, like graphic performance and responsiveness, the biggest challenge by far was debugging. We have gotten used to working with the awesome WebKit Web Inspector (A.K.A Chrome Developer Tools), with conditional breakpoints, DOM and CSS inspection, and the console. Switching to working with an iOS device or simulator, these capabilities were sorely missed. Here is a brief overview of our current debugging approach.
Chrome
Yes, you can run a PhoneGap app in Chrome. There are few obstacles to overcome, but it's definitely worth it.
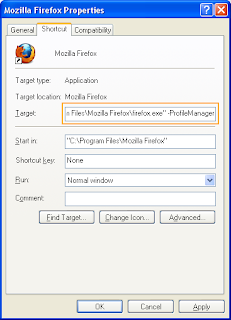
The first obstacle is that Chrome has a relatively restrictive cross-origin policy. Even the simplest PhoneGap apps will run into problems trying to include js and css files from the file:/// protocol, not to mention trying to access a server. Fortunately, Chrome has a "--disable-web-security" command line switch to shut all this protection down. Be warned! shutting down web security makes your browser extremely vulnerable to attack, even when browsing respectable and secure websites. Do not use a security-disabled browser for anything other than running your own code. My recommendation is to create a new shortcut (I think we use a command file on the Mac, but I don't have it with me to check now) which runs Chrome with both a "--disable-web-security" and a "--user-data-dir=/Users/unsafeChromeProfile" (or some other folder, say "C:\unsafeChromeProfile" on Windows). Name the shortcut properly ("Unsafe Chrome") and don't use it for anything else.
The second obstacle is that none of the PhoneGap APIs will work in Chrome. The solution is of course to use stubs. We have a simple utility function isPhoneGap() which checks whether we are in a PhoneGap webview or in Chrome, which we use to decide whether to use the PhoneGap API or some stub alternative.
Weinre
Weinre (we pronounce it "winery") is an incredibly useful tool which makes most of the WebKit Web Inspector available over the network. It's short for Web Inspector Remote. We use the Mac installed version, and it allows us to inspect the DOM, CSS, view console.log output and run commands from the console. If you're running on an iOS device or simulator, make sure you white-list the server address in your app's PhoneGap.plist file (we whitelist "*" in development, just make you remove it before packaging an ipa). Debugging in Chrome is much easier and friendlier, but once every couple of hundred lines of code you'll get a bug that only happens on a device, and then weinre is your friend to figure out what's going wrong.
Catching Exceptions
This is probably the trickiest part. When running from Chrome we can make use of the life-saving debugger. In that case, you want to make sure you set your debugging mode to "pause on uncaught exceptions", and make sure you don't catch any exceptions which aren't part of the normal flow. However, when running on the device or simulator, there is no debugger available (oh, how I wish there was). In that case, you want to wrap as much of your code as possible with try..catch blocks that would let you know that you had an exception, plus all the information you can gather about it, by printing it to console output (which is visible in Xcode and in weinre). I've spent some time writing a utility that systematically wraps each method of each of our classes with such a block (we use Backbone.js for classes, but the same wrapping could be applied to other class systems). If someone is interested I can try to extract it from our infra and share it, but it's relatively new so don't expect too much of it. I hope I'll find the time at some point to clean it up and open-source it.
The problem is that the iOS webkit used in PhoneGap does not seem to be very informative in the exceptions it passes to catch blocks. It does not provide a stack property, or even a file name and line number describing where the exception was thrown. All you get is a message describing the type of error, and even that message is usually quite general (e.g. "undefined is not an object" in an error where Chrome provides the much more helpful "Cannot run 'destroy' method of undefined"). What we did is extend the systematic wrapper above to manually maintain a string-array description of the current stack so we can print it when we catch an exception. We still can't get the specific line number, but it narrows it down to the function where the error occurred. If you keep your functions short (and it's generally a mark of good design if you do), this can go along way to identify where the bug is (remember, this is only for bugs that you can't reproduce in Chrome, otherwise you're much better off using the web inspector's debugger).
I don't know what the performance cost of all this wrapping is, but it's quite easy to make sure you only do it in your development and testing environments.
I hope this helps others struggling with the same challenges. I'll try to come back to this post and update as we learn more, but the easiest way to make sure this post becomes a useful resource, is for you readers to contribute your own perspective and/or raise any questions you may have in the comments. I promise to take the time to respond.
Comments
I actually could never get chrome to run using the --disable-web-security argument successfuly, so I just wrote a simple proxy that sends all my trafic to the server. Any ideas?
I liked the stack printing exception handling mechanism. Can you attach code sample?
Thanks